Google's 'Ripples': Seeing (and Understanding) Your Social Marketing Impact at One Glance
 Whether you're promoting an upcoming sale or chatting about the latest innovation in your business' field, if your social media followers aren't actively enjoying, engaging in and sharing your posts, then something needs to change. Until recently, most social media marketers and small business owners were only able to see the impact of their social media outreach by gauging the amount of response their website received after a post and by checking their website's analytics page. Some even reached out to third party analytics companies for detailed evaluations of their efforts.
Social media sites soon realized, however, that if they were going to bring in any degree of advertising, they needed to have their own analytics pages. This past year has seen a burst of upper echelon social media companies launching analytics pages and most of them are appearing in a format similar to a Google Analytics page: except for Google's own Google+.
Google+ launched in mid-2011 with an analytics tool that, appearance-wise, seemed to blow the rest out of the social media waters. Instead of the traditional line and pie charts, Google+ created an analytics program called Ripples which visually sums up a Google+ user's efforts in a clear, simple format that just might symbolize the future of viewing analytics.
The importance of analytics
When small business owners review their analytics page, they're typically looking for the following things:
Engagement: how many new visitors have been to your site over a certain period of time and how many are return visitors?
Activity: What are your visitors viewing? What content is the most popular? Are current promotions impacting your company website?
Variables: What makes up your highest visitor demographic?
Impact: What types of marketing are having the most impact? Which visits are converting to website hits and what is generating organic traffic?
KPI: What are your key performance indicators? What actions are creating the best return on investment (ROI)?
Analytics tools allow the user to see a lot of these factors at once. Line charts might compare past months to current months, pie charts could show the percentage of traffic from different parts of the world, and bar graphs might display the amount of new visitor traffic today compared to yesterday. Once you get the hang of what each chart represents and where to find it, it becomes fairly easy to read. But Google+ decided to step out of this section-by-section mold and show site owners their individual posts' impacts all at once.
Gauging Your Ripple Effect
Google+ Ripples uses what can best be described as a bubble graph to instantly show the impact of any post. You can view the Ripple chart for any of your posts or any public post.
To view a Ripple, simply click on the small down arrow in the upper right hand corner of any Google+ post.
Click on the option "View Ripples" and a bubble chart will immediately display. The center of the chart, and largest bubble, is the post you clicked on, and radiating out from it are bubbles of varying sizes. The larger bubbles show people who have publicly shared your post and the smaller bubbles represent those who shared it from that secondary post. Individual bubbles represent one-off shares of your post and so on. Each bubble contains the name of the sharer, and by hovering over it you can see any comment they might have made and how many people directly re-shared it from them.
It might sound a little complicated in written form, but as a visual it works beautifully. This Ripple chart, for example, shows a post about how to spot a fake social media specialist that was publicly shared 37 times:
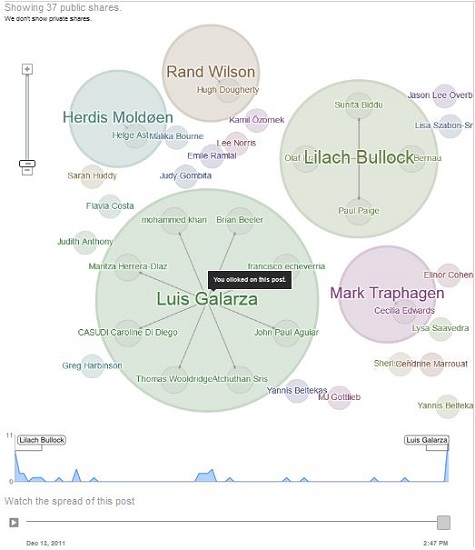
Instead of viewing several different graphs, it simply shows how much impact this one post had in your social circles. Even though this doesn't have the depth that a details analytics page can offer, it does give a 'quick and easy to understand' account of how followers are responding to each of your posts.
Other social media analytics
Though Google+ seems to have a good handle on visualizing the effectiveness of your social media campaign, several other major social media sites also have analytics pages with varying degrees of coverage:
Facebook: Facebook offers an analytics page called Facebook Insights. It allows users to view all of their Facebook pages and see at a glance how much their total reach varies, how many people are talking about their posts and how this has varied week to week. Each post is also listed with numbers displaying the reach, number of engaged users, who is talking about each and how many new people have shared it.
Twitter: Twitter's Web Analytics page provides graphs displaying how much traffic is being sent to your website from Twitter, how effective your Tweet button is on your site and how much your website content is being shared on Twitter. A separate graph also shows the number of tweets shared that include a link to your site and the number of times those links were clicked.
Pinterest: Pinterest just introduced its analytics page in March 2013. The tool allows users to track how many pinners are collecting pins from their site and how many re-pins those pins are receiving. Total impressions and referral traffic can also be tracked, though some have complained that the analytics tool only allows you to view the results from one site at a time.
If your business works with social media to any degree, understanding your analytics is an important step in broadening your reach and increasing your followers/potential clientele. And if quick and easy to understand visuals prove to be as helpful as they seem to be with Google+ Ripples, this format might soon catch on as the next wave in effective analytics.
What analytics apps or platforms have you used for your social media sites? Have you found one that seems to work better than others? What aspects of social media marketing do you wish were easier to view comprehensively?
 Delicious
 Digg
Digg StumbleUpon
 Propeller
 Reddit
 Magnoliacom
 Newsvine
Social Tracking
![]()
![]()
![]()
![]()
Comments
Post new comment